Kleta

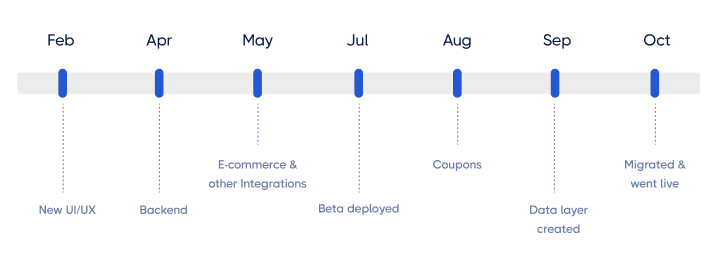
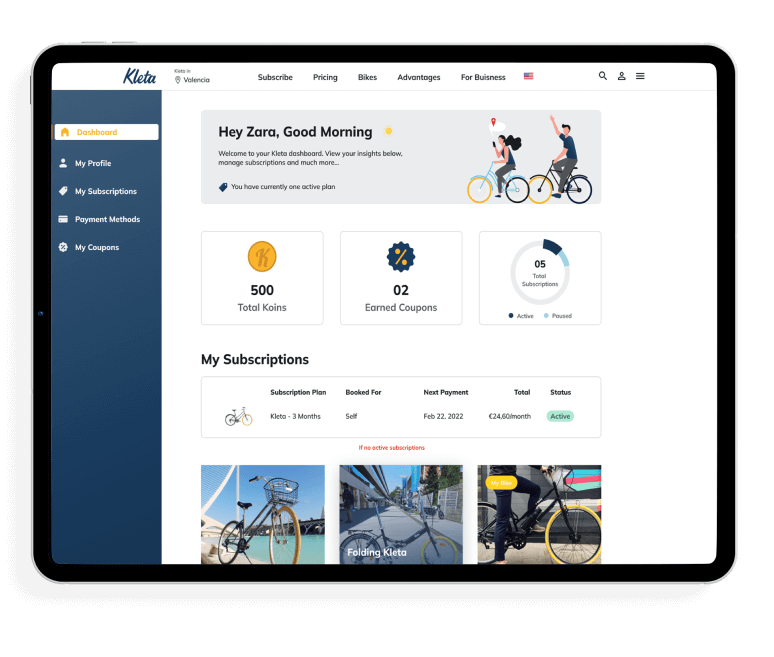
Kleta e-commerce migration to a modern stack and mobile app revamp.
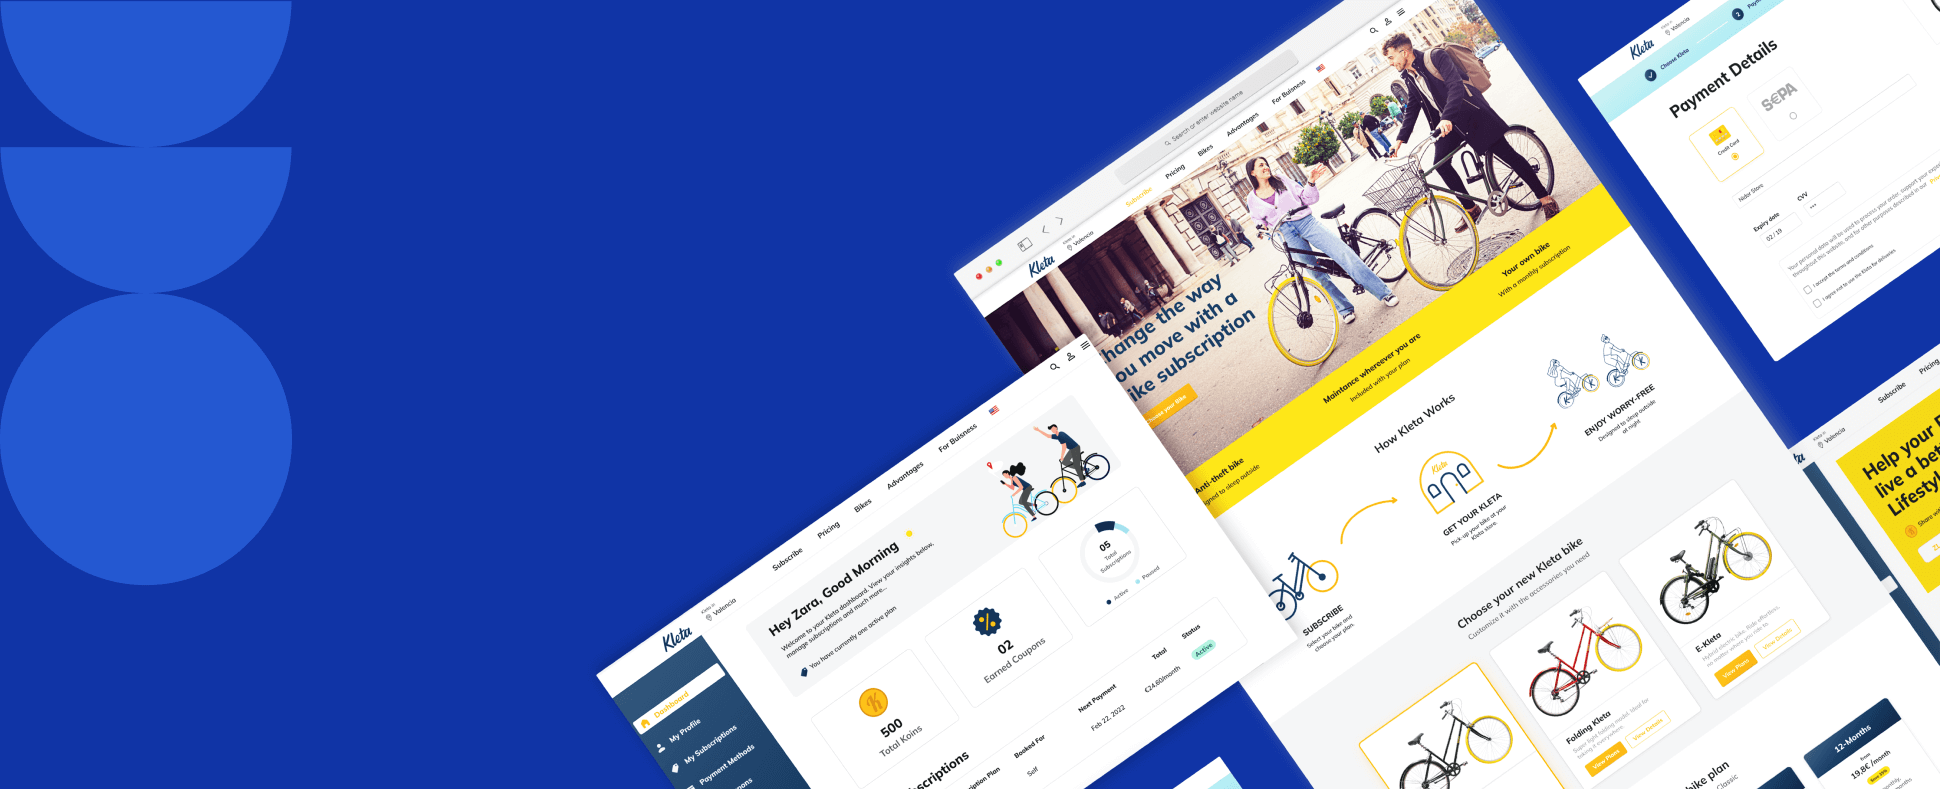
Kleta is a bike-rental subscription platform. See how we helped them scale their strategy and platform to deliver a better experience for riders.
Kleta is a bike-rental subscription platform. See how we helped them scale their strategy and platform to deliver a better experience for riders.

Kleta is a Barcelona-based cycle brand. It provides service for renting cycles on a monthly and yearly subscription basis. The modern lock system of the cycle ensures peace of mind for users. Cycles are well-requipped with child seats, baskets, phone holders, and helmets. Kleta believes that everyone has a right to use a bicycle without actually owning one.
350+
Total Customers
100+
Monthly Subscriptions
10+
Stores across Barcelona
Kleta was initially built on an old WYSIWYG (what you see is what you get) editor. To serve their users, they depended heavily on multiple plugins, 3rd party services, semi-automatic controls, and multiple data sources to keep the web and mobile apps in line.
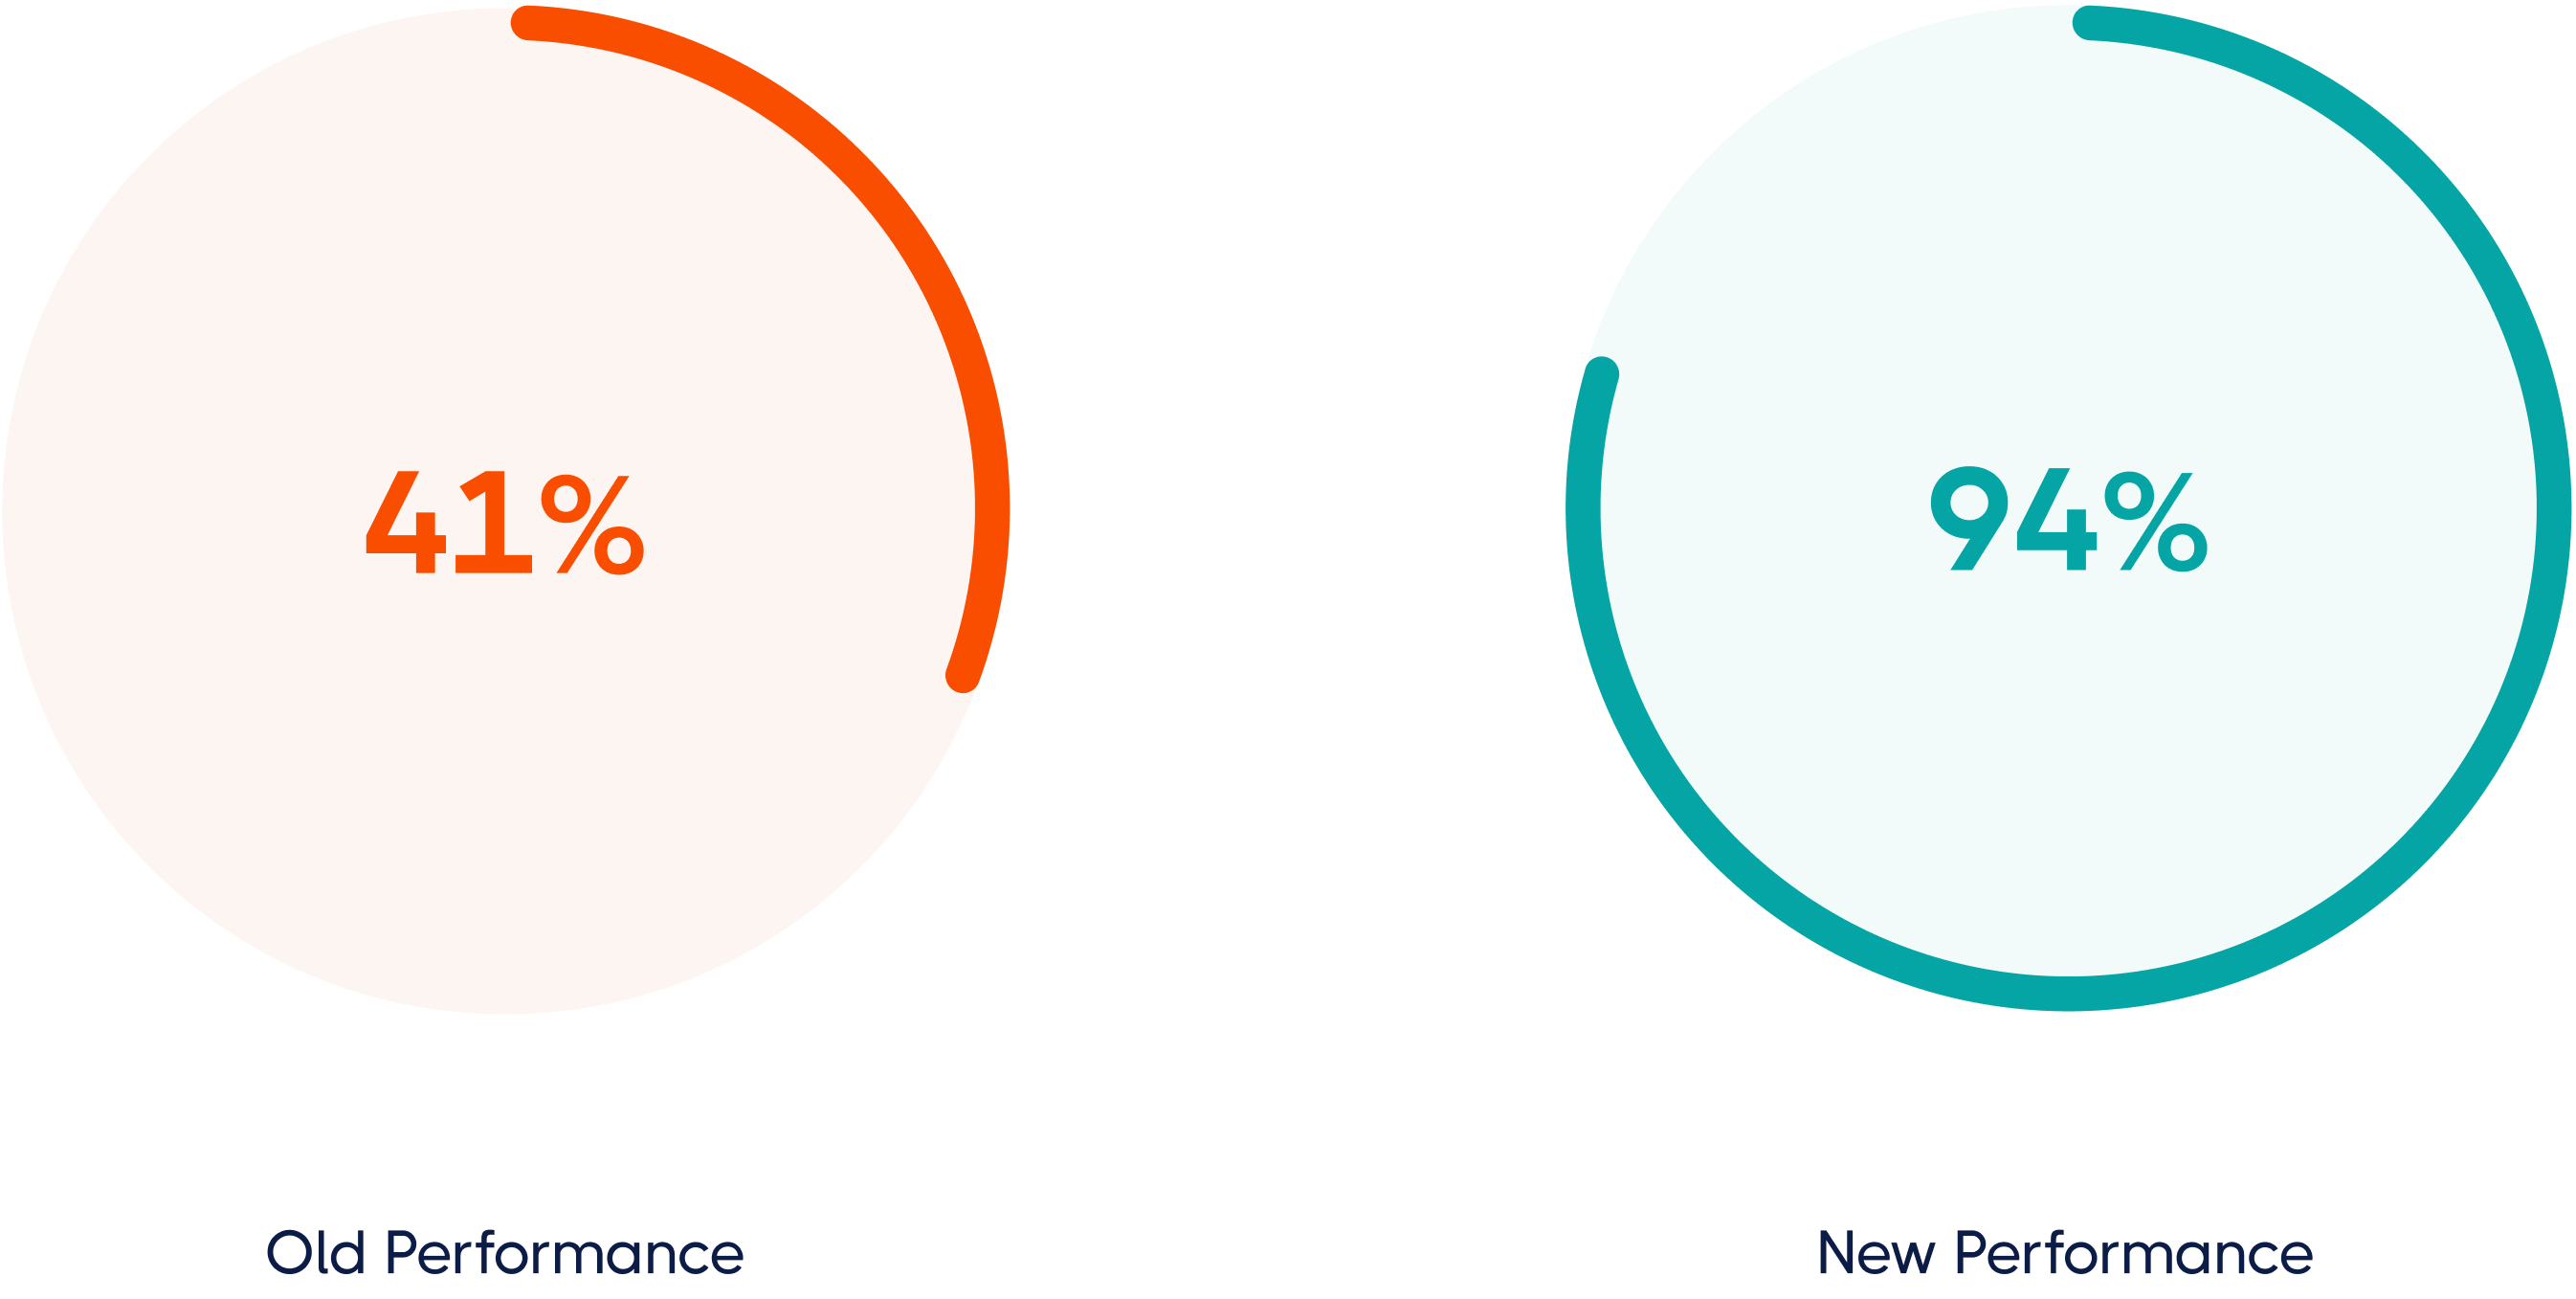
As a startup, they hooked up a great system, and it was working fine, but as soon as their user base increased, so did their challenges. Scalability was impossible with their old tech stack, and our job was to deliver a robust, scalable, and easily customizable solution. In addition, the web app was struggling with lighthouse performance scores.
The previous system had obstacles for the users when they tried to access the web app or wanted to purchase the product. The application was dependent on third-party services, which made the interface quite complicated for the user. In addition, there was a delay in placing orders as the fulfilment team had to enter some data manually.






Product Design UI/UX
Read more
Full-Stack Engineering
Read more
Mobile App Development
Read more
Data Analytics
Read more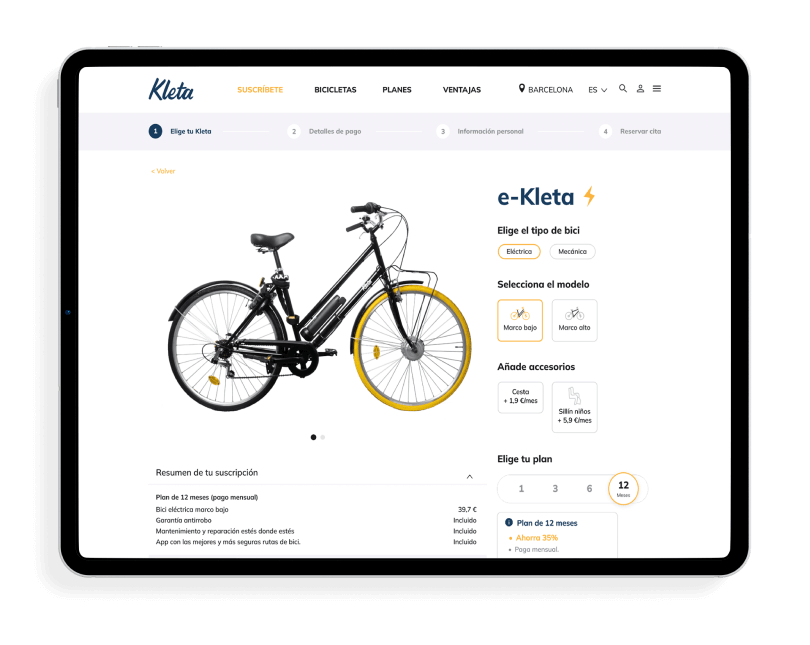
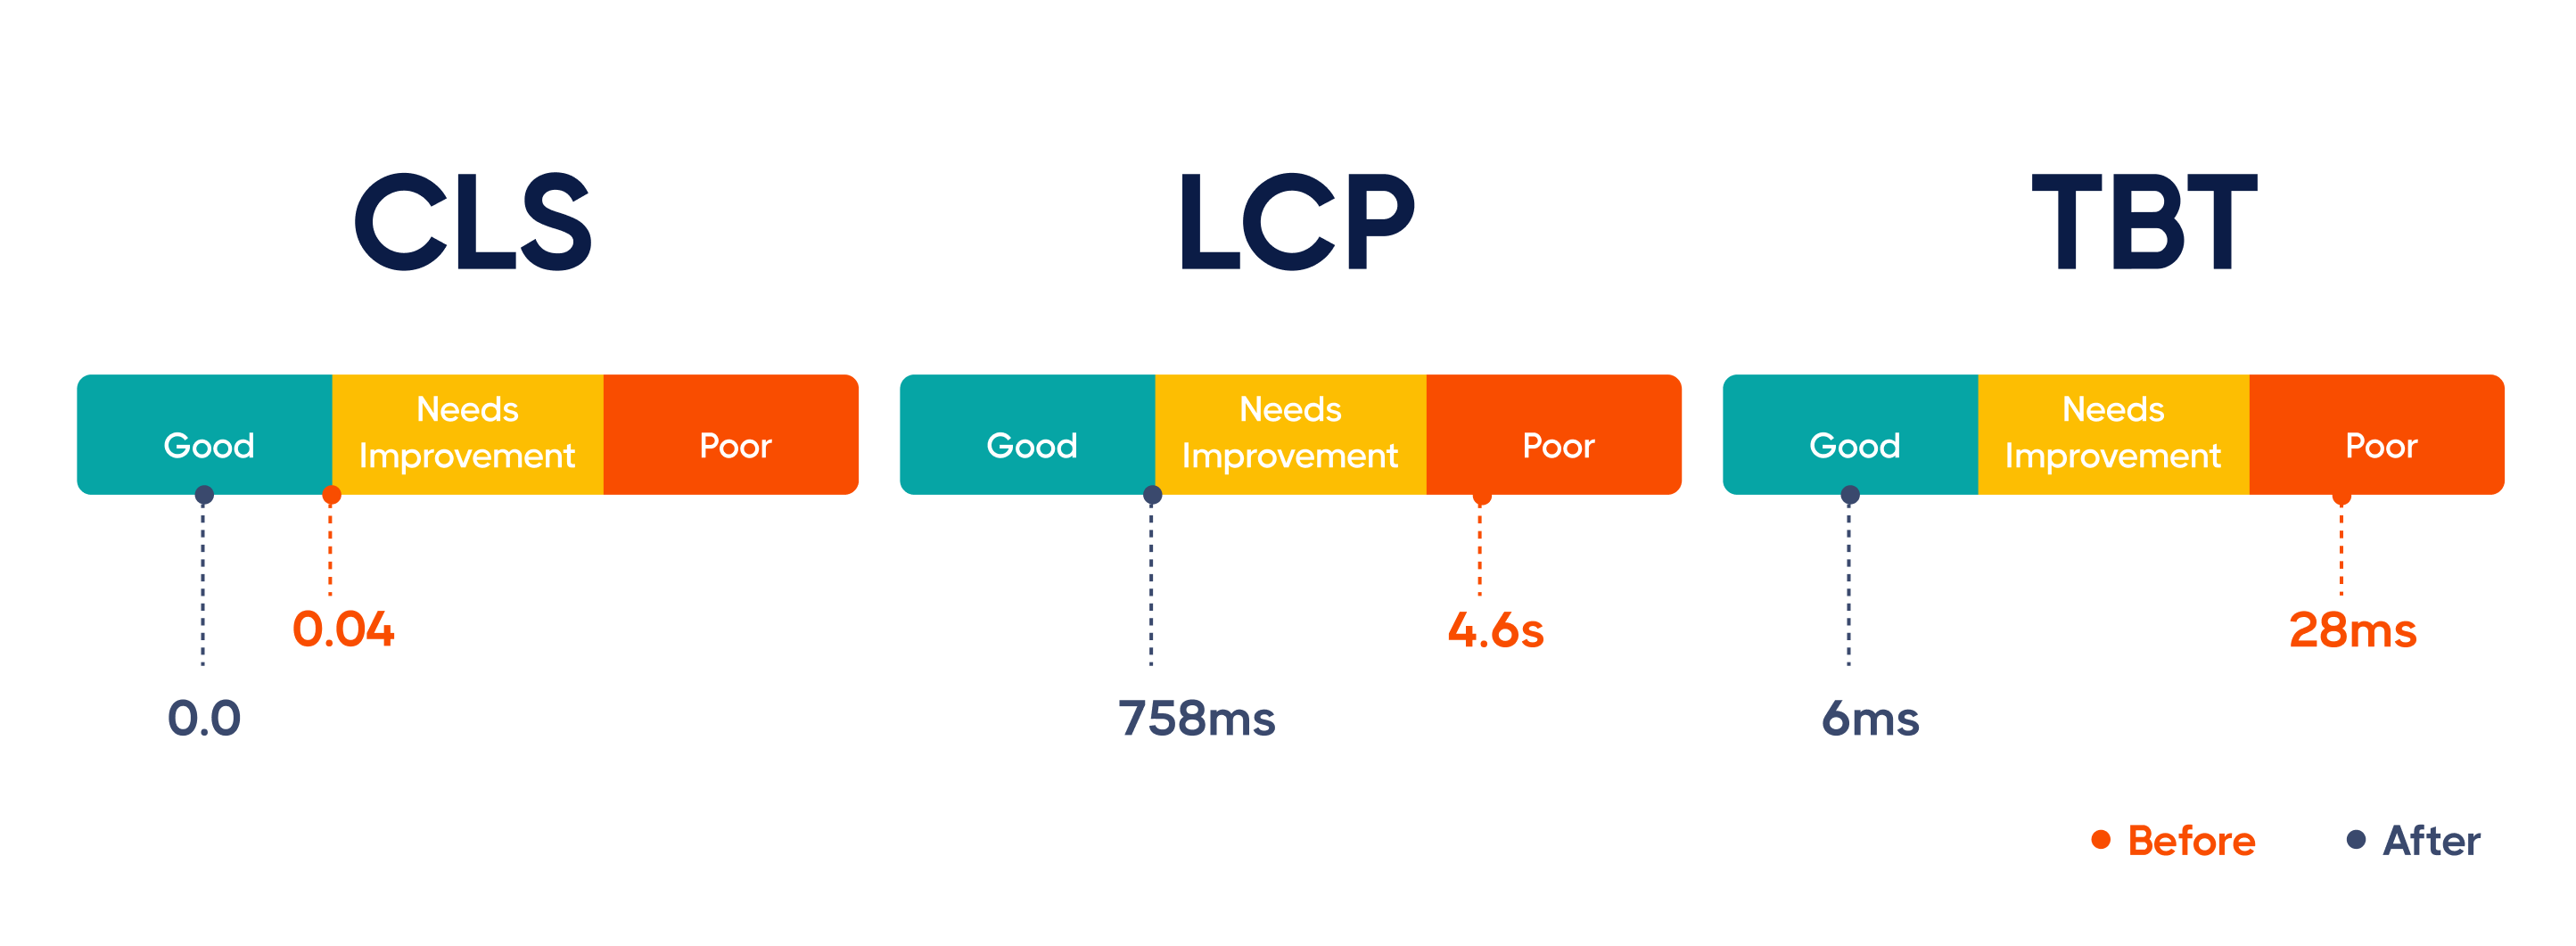
Lighthouse performance score is the sum of any website's performance based on its metrics. The lighthouse performance scores consist of 6 different web performance metrics
It is measured in milliseconds and is used to evaluate the loading time of a website at which the user has something helpful to look at.

It analyses the average time a page takes to load its content. The score should be as low as possible depending on the page's viewport size.

This measures the time it takes for the website to render the largest page element. Good LCP is considered when it is 2.5 sec or less. If it is either, then it needs improvement.

It measures the time to load all the content of the website till it is ready for interaction.

It measures the response time of the website post user input. TBT measures the time when a CPU task takes longer than 50ms. For example, if one of the tasks takes 120ms, the overall TBT will add up to 70ms.

It measures the stability of the content on the page and how much content moves around the page when it is rendered. The lower the CLS is, the better; when CLS is 0, it means that the page is entirely stable.

Get in Touch
Ready to help you realize your dream
Contact us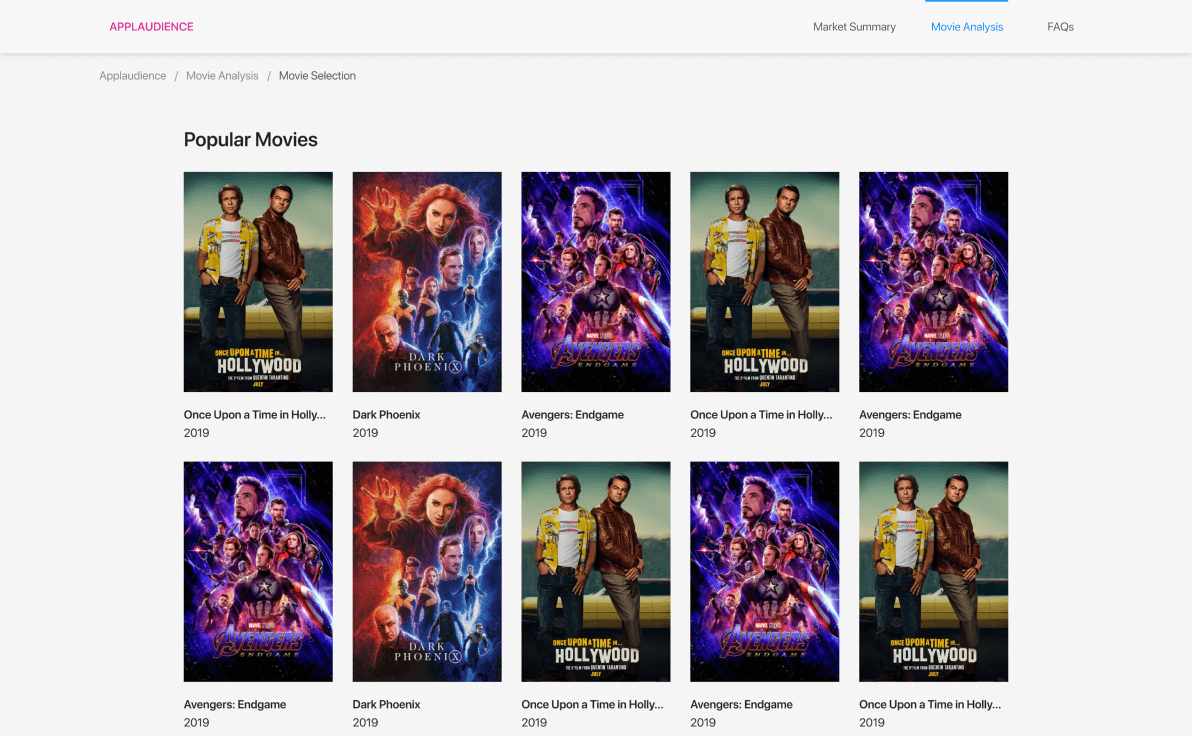
Online data analytics dashboard to track and predict movie sales behavior in real-time across multiple cinema chains.
Applaudience is an online data analytics dashboard to track and predict movie sales behavior in real time across multiple cinema chains.
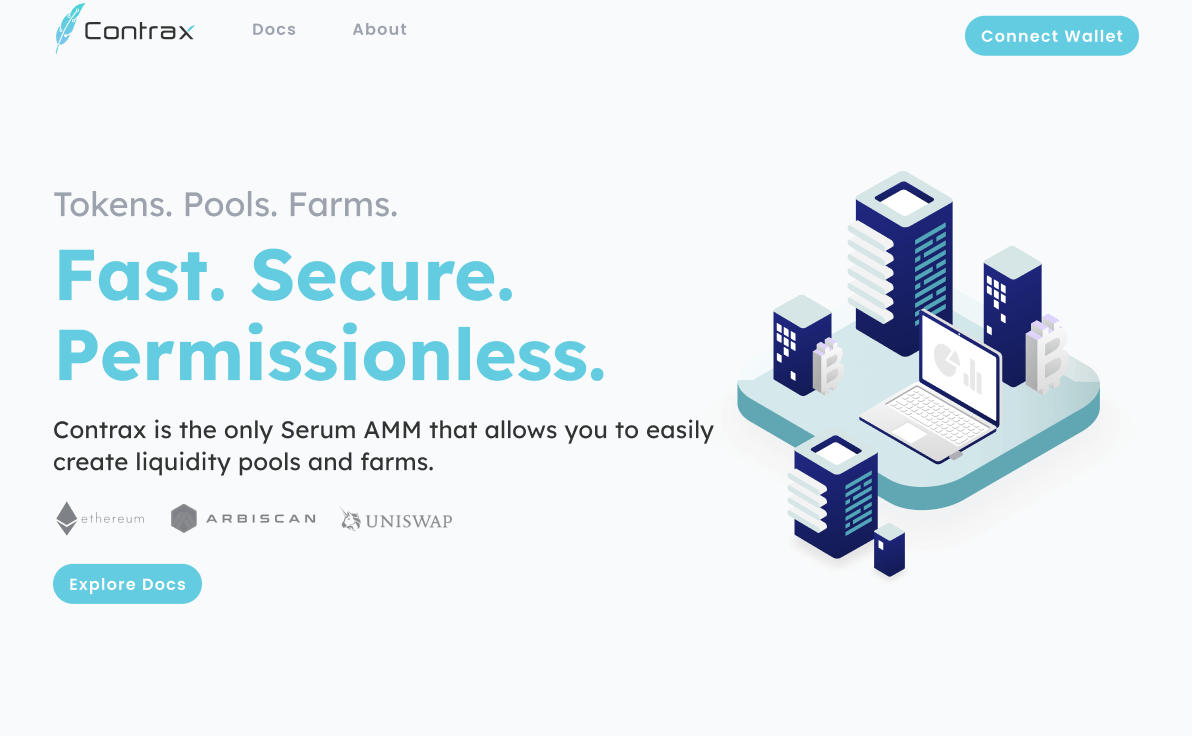
Developing open source, no-code tools and auto-compounding vaults for tangible yield assets on Ethereum and Arbitrum blockchains
A decentralized web application for people to create crypto tokens, liquidity pools, and auto-compounding farms on the Ethereum & Arbitrum blockchains.